Interactive Python course
Python Pandas for Data Analysis
Learn Python Pandas with 36 interactive lessons. Filter DataFrames, clean data, merge tables, and build reports using a Google Search dataset.
What will you learn?
Use Pandas to select and filter rows, handle missing values, clean text, group and aggregate records, merge related tables, and reshape reports. Then work with timestamps, rolling windows, and week-over-week changes.
The final module combines these skills into device, search-query, result-position, and weekly performance reports. You will distinguish search-level click-through rate from result-level click-through rate and export a report as CSV.
How the course works
Each lesson includes an explanation, a table illustration, and three coding steps: Learn, Try, and Check. Run your Python code in the browser to see its output and check your answer. No local installation is needed.
You work with four related DataFrames: searches, search_results, clicks, and pages. The Google Search analysis scenario is used throughout; the course is independently produced by DataInterview and is not affiliated with Google.
Who is this course for?
Analysts, aspiring data scientists, and SQL users learning to analyze tabular data in Python. You should already understand Python variables, lists, and function calls. No prior Pandas experience is required.
What is free?
Everyone can read all 36 lessons. Sign in to run code and use hints and solutions in the first four lessons. Premium unlocks practice, hints, and solutions for lessons 5–36, plus custom code in the database workspace. There is no daily practice limit.
Python Pandas curriculum
Work with DataFrames
- 1Meet a DataFrameInspect rows, columns, and the size of a Pandas DataFrame.Free practice
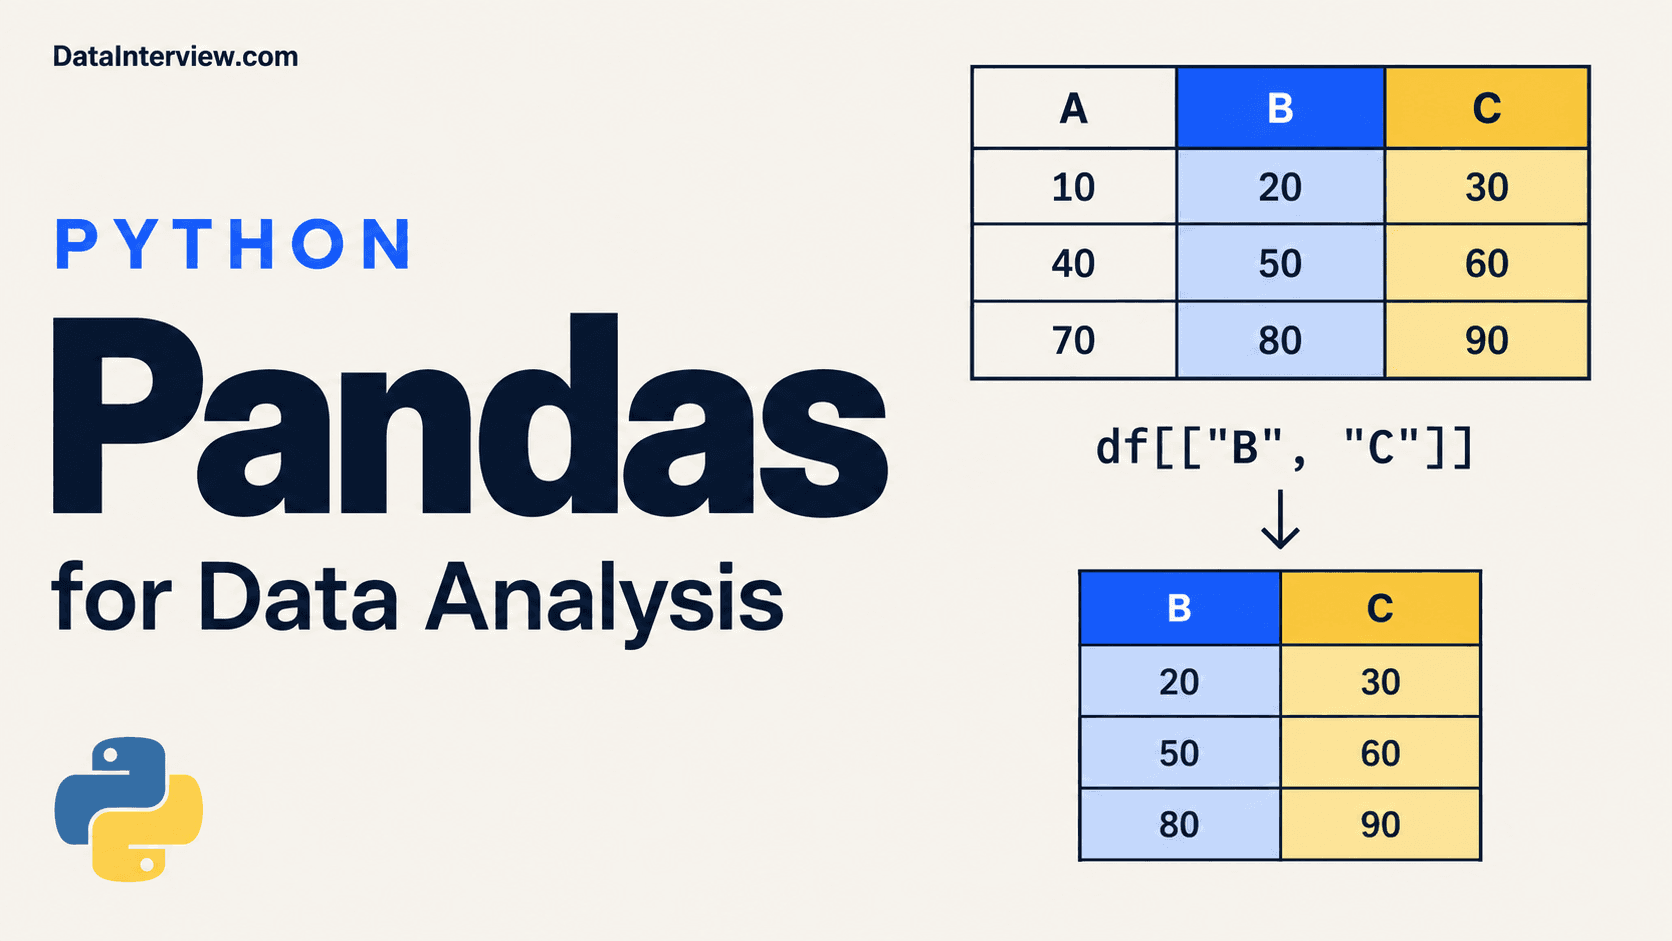
- 2Select columnsChoose columns and distinguish a Series from a DataFrame.Free practice
- 3Select rows with loc and ilocSelect by index label or row position without confusing the two.Free practice
- 4Inspect and name your dataInspect column types and numeric summaries, then rename columns without changing their values.Free practice
Filter and sort searches
- 5Filter rowsUse Boolean conditions to keep matching rows and select the columns to return.Premium practice
- 6Combine conditionsCombine row-level conditions with AND, OR, and NOT using Pandas Boolean operators.Premium practice
- 7Match lists and rangesMatch several values with isin and control numeric range boundaries with between.Premium practice
- 8Sort and take the top rowsSort ascending or descending, resolve ties, and take a reproducible top-N result.Premium practice
Clean values and create columns
- 9Handle missing valuesIdentify missing values, keep known observations, and choose when filling or dropping is appropriate.Premium practice
- 10Convert data typesParse numeric text, identify failed conversions, and preserve missing values with nullable types.Premium practice
- 11Calculate new columnsUse column-wise arithmetic to derive measurements while preserving the originals.Premium practice
- 12Update values safelySet values with loc and choose between where and mask without chained assignment.Premium practice
Summarize search activity
- 13Count rows and unique valuesDistinguish all rows, recorded values, distinct users, and frequency counts.Premium practice
- 14Group and aggregateReduce search rows to counts, totals, and averages for each device.Premium practice
- 15Build multi-metric reportsName several aggregations and summarize each country-device pair.Premium practice
- 16Calculate rates and filter groupsUse the right denominator for a rate and filter after grouping.Premium practice
Prepare text and combine files
- 17Clean query textNormalize query whitespace and capitalization without overwriting the original text.Premium practice
- 18Find patterns in textMatch literal text safely and extract a defined URL pattern.Premium practice
- 19Recognize duplicate recordsIdentify repeated event IDs without deleting distinct searches that share query text.Premium practice
- 20Load and combine daily filesRead two CSV extracts, append their rows, and export without an index column.Premium practice
Connect searches, results, and clicks
- 21Add page details with mergeAttach page metadata to result impressions without multiplying or dropping rows.Premium practice
- 22Keep matches or keep every searchCompare inner and left merges and identify searches without clicks.Premium practice
- 23Join on multiple keysMatch a click to its exact result impression using search ID and position together.Premium practice
- 24Measure click-through rate correctlyCount clicked searches once and retain unclicked searches in the CTR denominator.Premium practice
Reshape and compare groups
- 25Pivot a reportMove unique country-device pairs into a wide table without aggregating again.Premium practice
- 26Aggregate while pivotingBuild wide counts, totals, and means directly from search events.Premium practice
- 27Return to a long tableUnpivot device columns into labeled country-device rows.Premium practice
- 28Add group context to rowsRepeat a device statistic beside each search and rank timings within device groups.Premium practice
Analyze activity over time
- 29Parse and filter timestampsParse text as UTC timestamps and filter complete days with half-open boundaries.Premium practice
- 30Build daily and weekly reportsResample UTC events into complete daily and Monday-start weekly calendars.Premium practice
- 31Compare with the previous periodAlign yesterday's count and compute changes without inventing growth from a zero baseline.Premium practice
- 32Calculate rolling metricsChoose a trailing window and minimum coverage explicitly.Premium practice
Build a search performance report
- 33Build the device summaryCombine counts, distinct users, and correctly defined rates in one device report.Premium practice
- 34Find frequently searched queriesNormalize query variants, apply a volume minimum, and rank with deterministic ties.Premium practice
- 35Compare result positionsMeasure result CTR using impressions and distinct clicked result keys.Premium practice
- 36Create the weekly overviewCombine weekly search volume, clicked searches, CTR, changes, and CSV export.Premium practice