Join Data Science Interview MasterClass (September Cohort) led by FAANG Data Scientists | Just 6 seats remaining...
Data Science MasterClass (September) | 6 seats left
Market Size Estimation Patterns
Market Size Estimation Patterns
At Jane Street and Optiver, getting the right answer is almost beside the point. What the interviewer is actually watching for is whether you can decompose an unfamiliar quantity into estimable pieces, anchor to numbers you trust, and defend every assumption when challenged. The final number is just evidence that your process worked.
Market size estimation is the skill of building that process out loud. You're given a quantity, say daily US equity trading volume or total FX market turnover, and you have to reason your way to an order-of-magnitude answer using financial benchmarks, logical structure, and clean arithmetic. No lookup tables. No Googling. Just your mental model of how markets work.
The questions you'll face are grounded in finance, not trivia. Forget piano tuners in Chicago. You'll be asked things like "what's the notional value of the US options market?" or "how does daily equity volume compare to the S&P 500's total market cap?" These questions assume you've internalized a handful of financial anchors, like US GDP around $28 trillion, NYSE daily volume in the tens of billions, global FX turnover near $7.5 trillion per day, and that you can build outward from them.
Two types of candidates consistently fail these questions. The first grabs a number from memory, states it confidently, and has nothing to say when the interviewer asks "how did you get that?" The second builds an impressively detailed model, gets lost in the arithmetic, and can't summarize the answer when asked. Both are dead ends. The path through is choosing your decomposition strategy before you touch a single number.
The Two-Phase Structure Every Estimation Follows
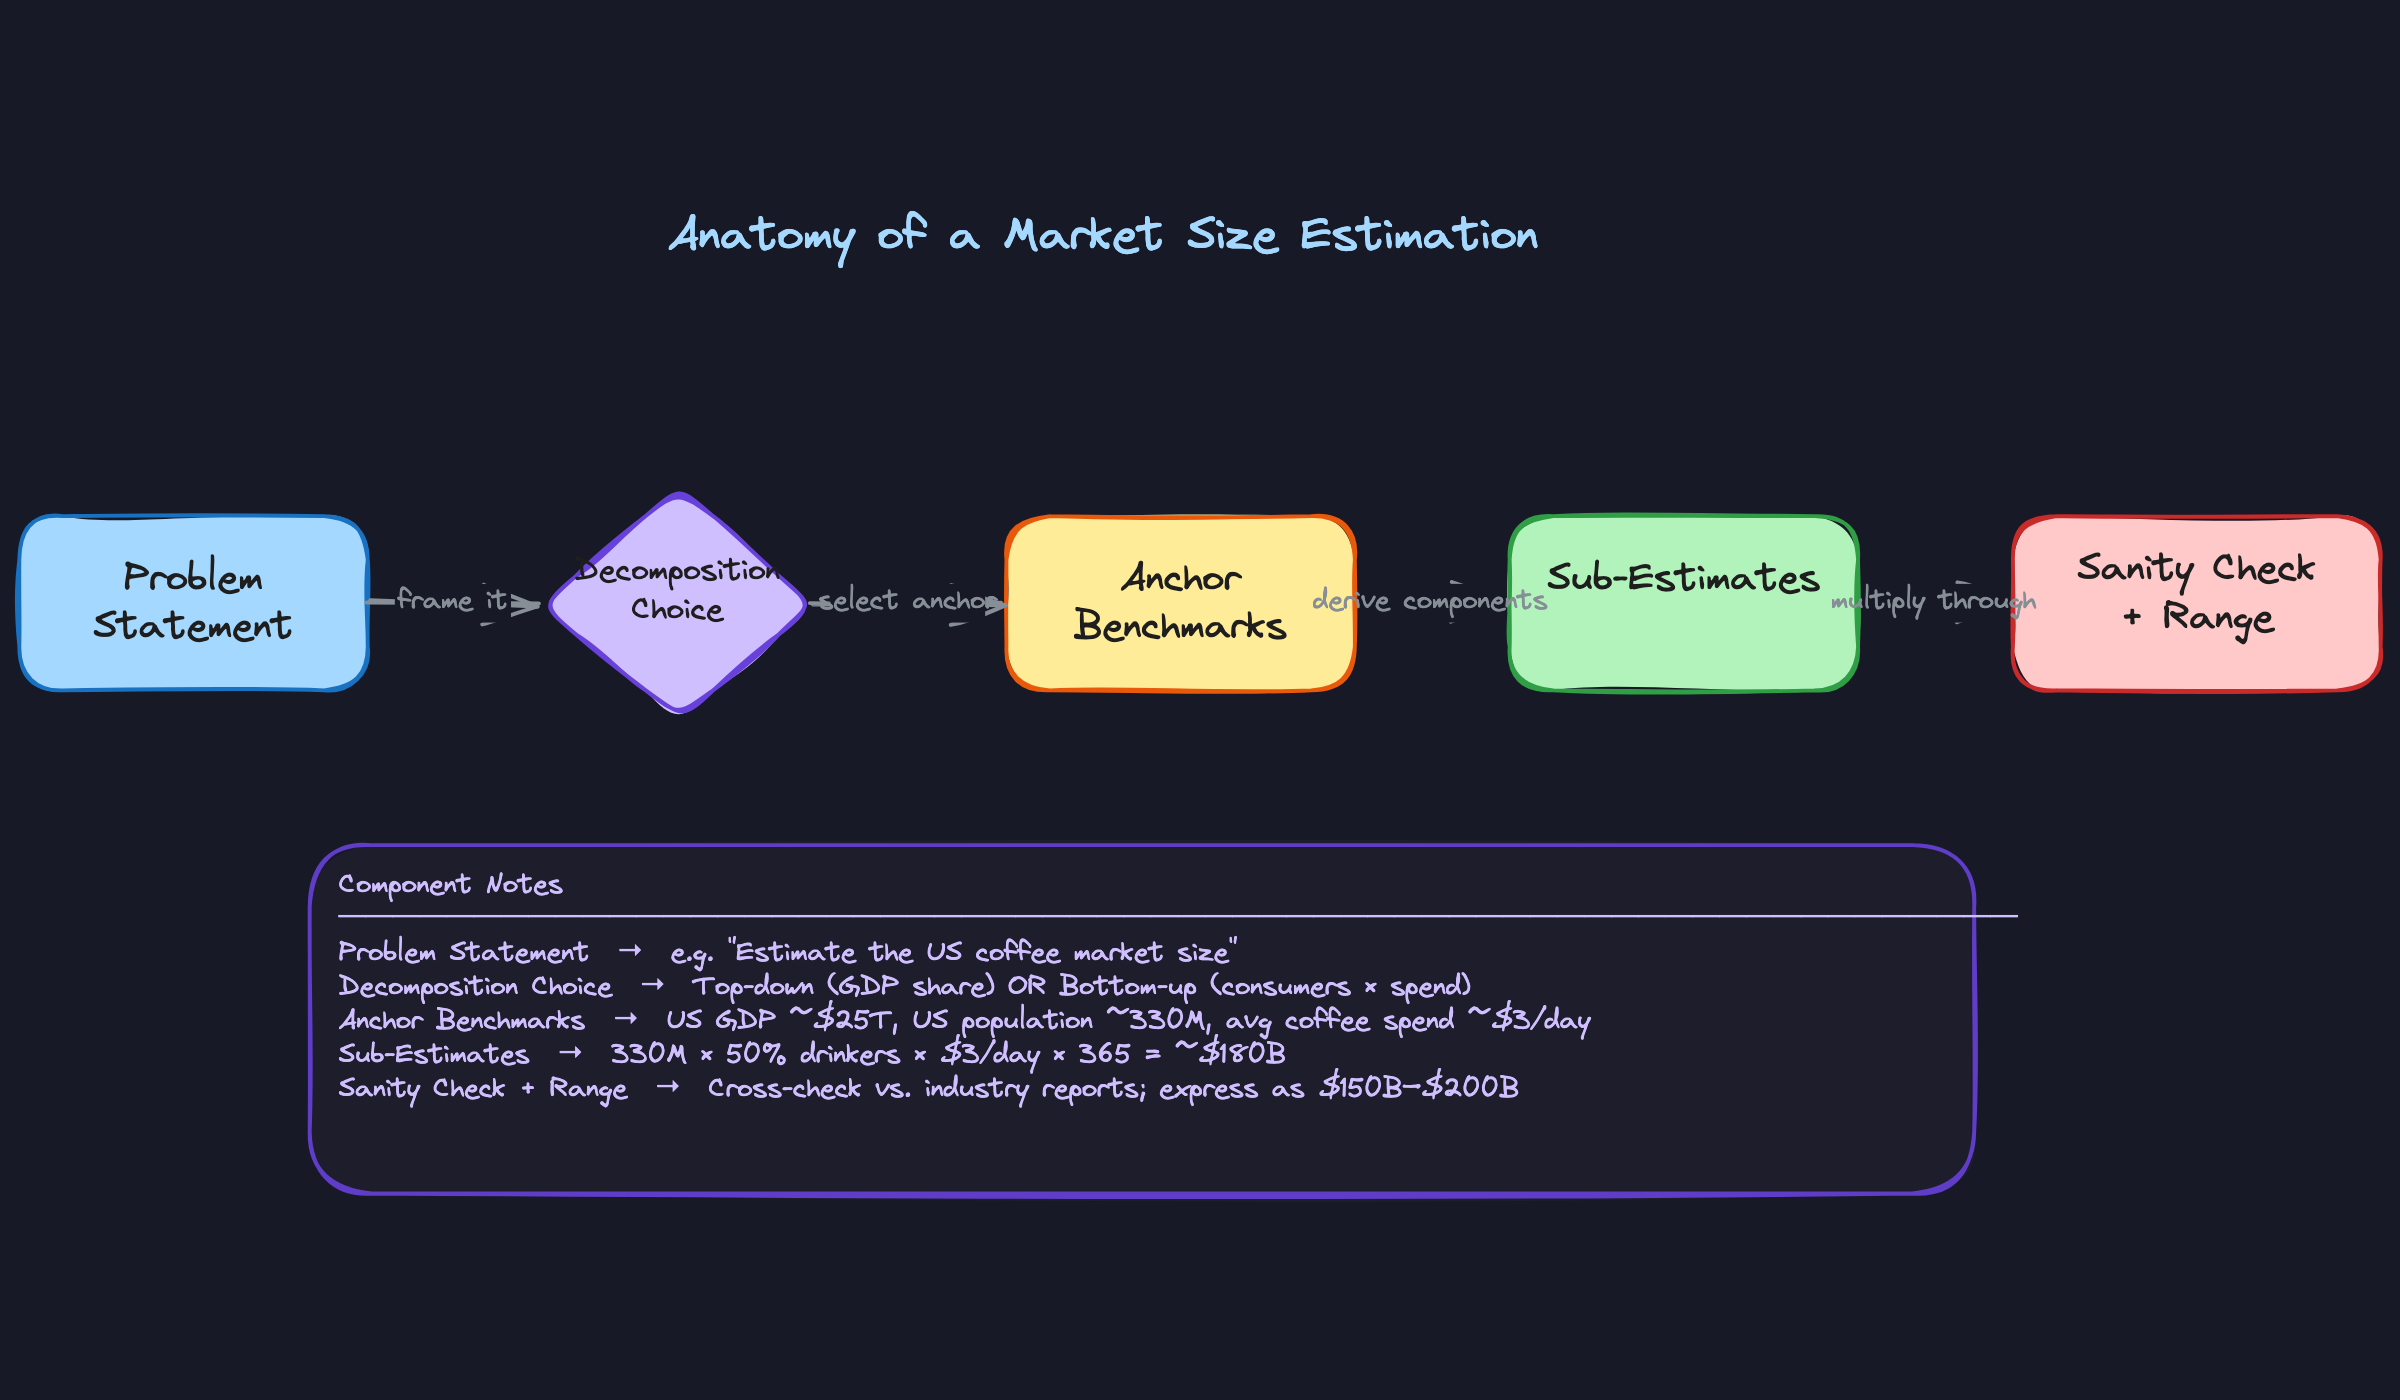
Every market size estimation has the same skeleton, regardless of what you're estimating. First, you break the problem into pieces you can actually estimate. Then you multiply through, track your units, and check whether your answer makes sense against something you already know.
That's it. Two phases. The failure mode is skipping phase one and jumping straight into arithmetic.
Think of it like dead reckoning on a ship: you pick a known position, then navigate step by step using speed and direction. Your anchor is that known position. Everything else follows from it.
Here's what that flow looks like:
Anchors: Your One Non-Negotiable Starting Point
Before you touch any arithmetic, you need at least one number you're genuinely confident in. Not a guess. A benchmark you could defend if the interviewer asked "how do you know that?"
The ones worth memorizing: US GDP is roughly $28 trillion per year. The S&P 500 market cap sits around $45 trillion. NYSE daily equity volume runs in the $25-50 billion range. Global FX daily turnover is approximately $7.5 trillion. These aren't trivia; they're the fixed points your entire estimation hangs from.
Your interviewer cares about this because an estimation without a defensible anchor is just a random number dressed up in math. When they push back on your answer, the first thing they'll ask is "what are you anchoring to?" You need a real answer.
Decomposition: Top-Down vs. Bottom-Up
Once you have an anchor, you have a choice. You can start from a large aggregate and carve it into pieces (top-down), or you can start from individual units and scale up (bottom-up).
Top-down looks like: "US GDP is $28T, financial services is roughly 8% of that, equities are maybe a third of financial activity, divide by 250 trading days..." Bottom-up looks like: "There are roughly 5,000 active hedge funds, average daily notional per fund is maybe $500M, plus retail and market makers..."
The paths should land within the same order of magnitude. If your top-down estimate is $400B/day and your bottom-up is $40B/day, one of your assumptions is badly wrong. That divergence is actually useful information, and pointing it out signals exactly the kind of calibrated thinking these firms want.
Unit Discipline Is Not Optional
Write your units at every step. Dollars per year. Contracts per participant per day. Shares per trade. This sounds tedious until you realize that most arithmetic errors in estimation interviews come from silently mixing annual and daily figures, or confusing notional value with share count.
An answer that's off by 250x (the number of trading days in a year) is a common and entirely avoidable mistake. Keeping units explicit also signals rigor to the interviewer. It shows you're tracking what you're actually computing, not just pushing numbers around.
Always Land on a Range
A single point estimate is a red flag. Saying "$412 billion" implies a precision your model cannot possibly support, and interviewers know it. The target format is something like: "I'd estimate around $400B per day, probably in the $300-550B range depending on how you treat market maker internalization and what volatility regime you assume."
That range communicates two things: you understand the sensitivity of your answer to your assumptions, and you're calibrated about your own uncertainty. Both matter more than the specific number.
Patterns You Need to Know
In an interview, you'll usually need to pick a specific approach. Here are the ones worth knowing.
Top-Down from GDP or Market Cap
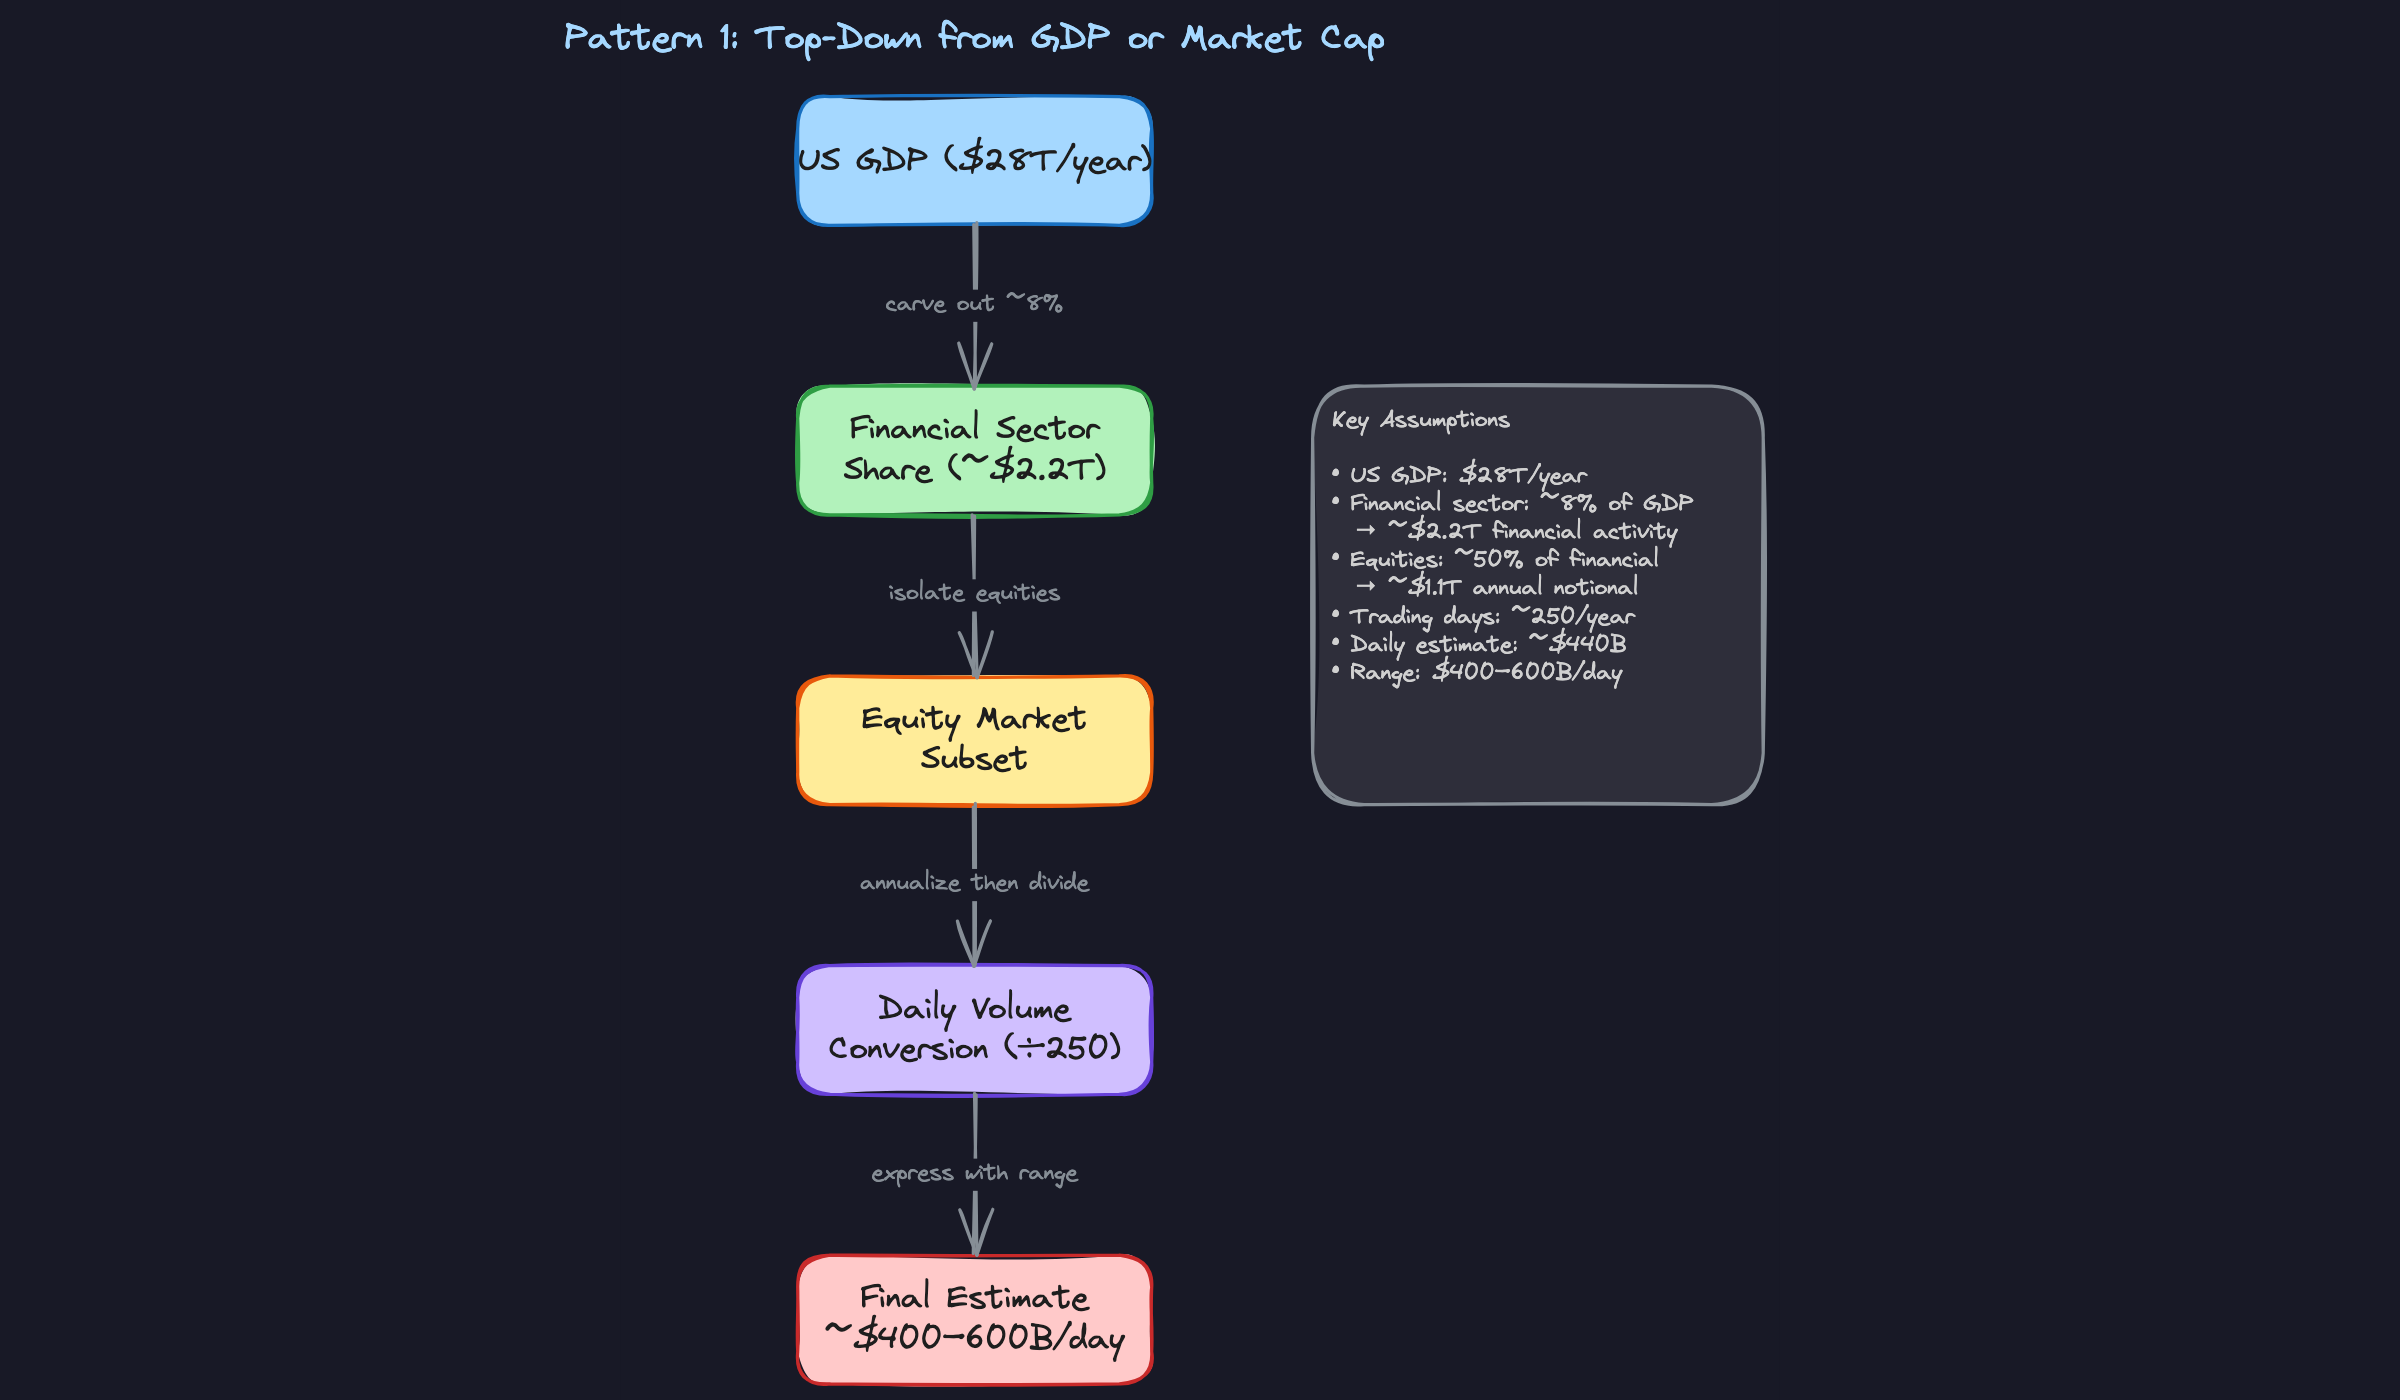
Start with a number you're confident in, then carve out the slice that's relevant to your question. For US equity trading volume, market cap is a cleaner anchor than GDP. The US equity market cap sits around $45-50T. From there, you need a turnover assumption: US equities are among the most actively traded assets in the world, with annual turnover somewhere in the 200-300% range. At 250% annual turnover on a $45T base, you get roughly $112T in annual notional traded. Divide by 250 trading days and you land around $450B per day, which is consistent with what NYSE and Nasdaq actually report.
GDP can still be useful as a sanity check or a starting point for sizing a market's economic significance, but it measures value-added activity, not notional flow. Trying to go directly from "financial sector is 8% of GDP" to "daily trading volume" requires too many heroic assumptions to be credible. Stick to market cap when the question is about trading volume.
The key move here is being explicit about each carve-out. Don't just say "equities are a big part of finance." Say "I'm assuming annual turnover is around 250%, which I'd revise upward in a high-volatility regime." That kind of narration is what separates a structured answer from a lucky guess.
When to reach for this: Any question where you know a reliable aggregate and the target quantity is a well-defined fraction of it. "Estimate total US equity trading volume" or "how large is the US corporate bond market" both map cleanly here.
Bottom-Up from Participants and Behavior
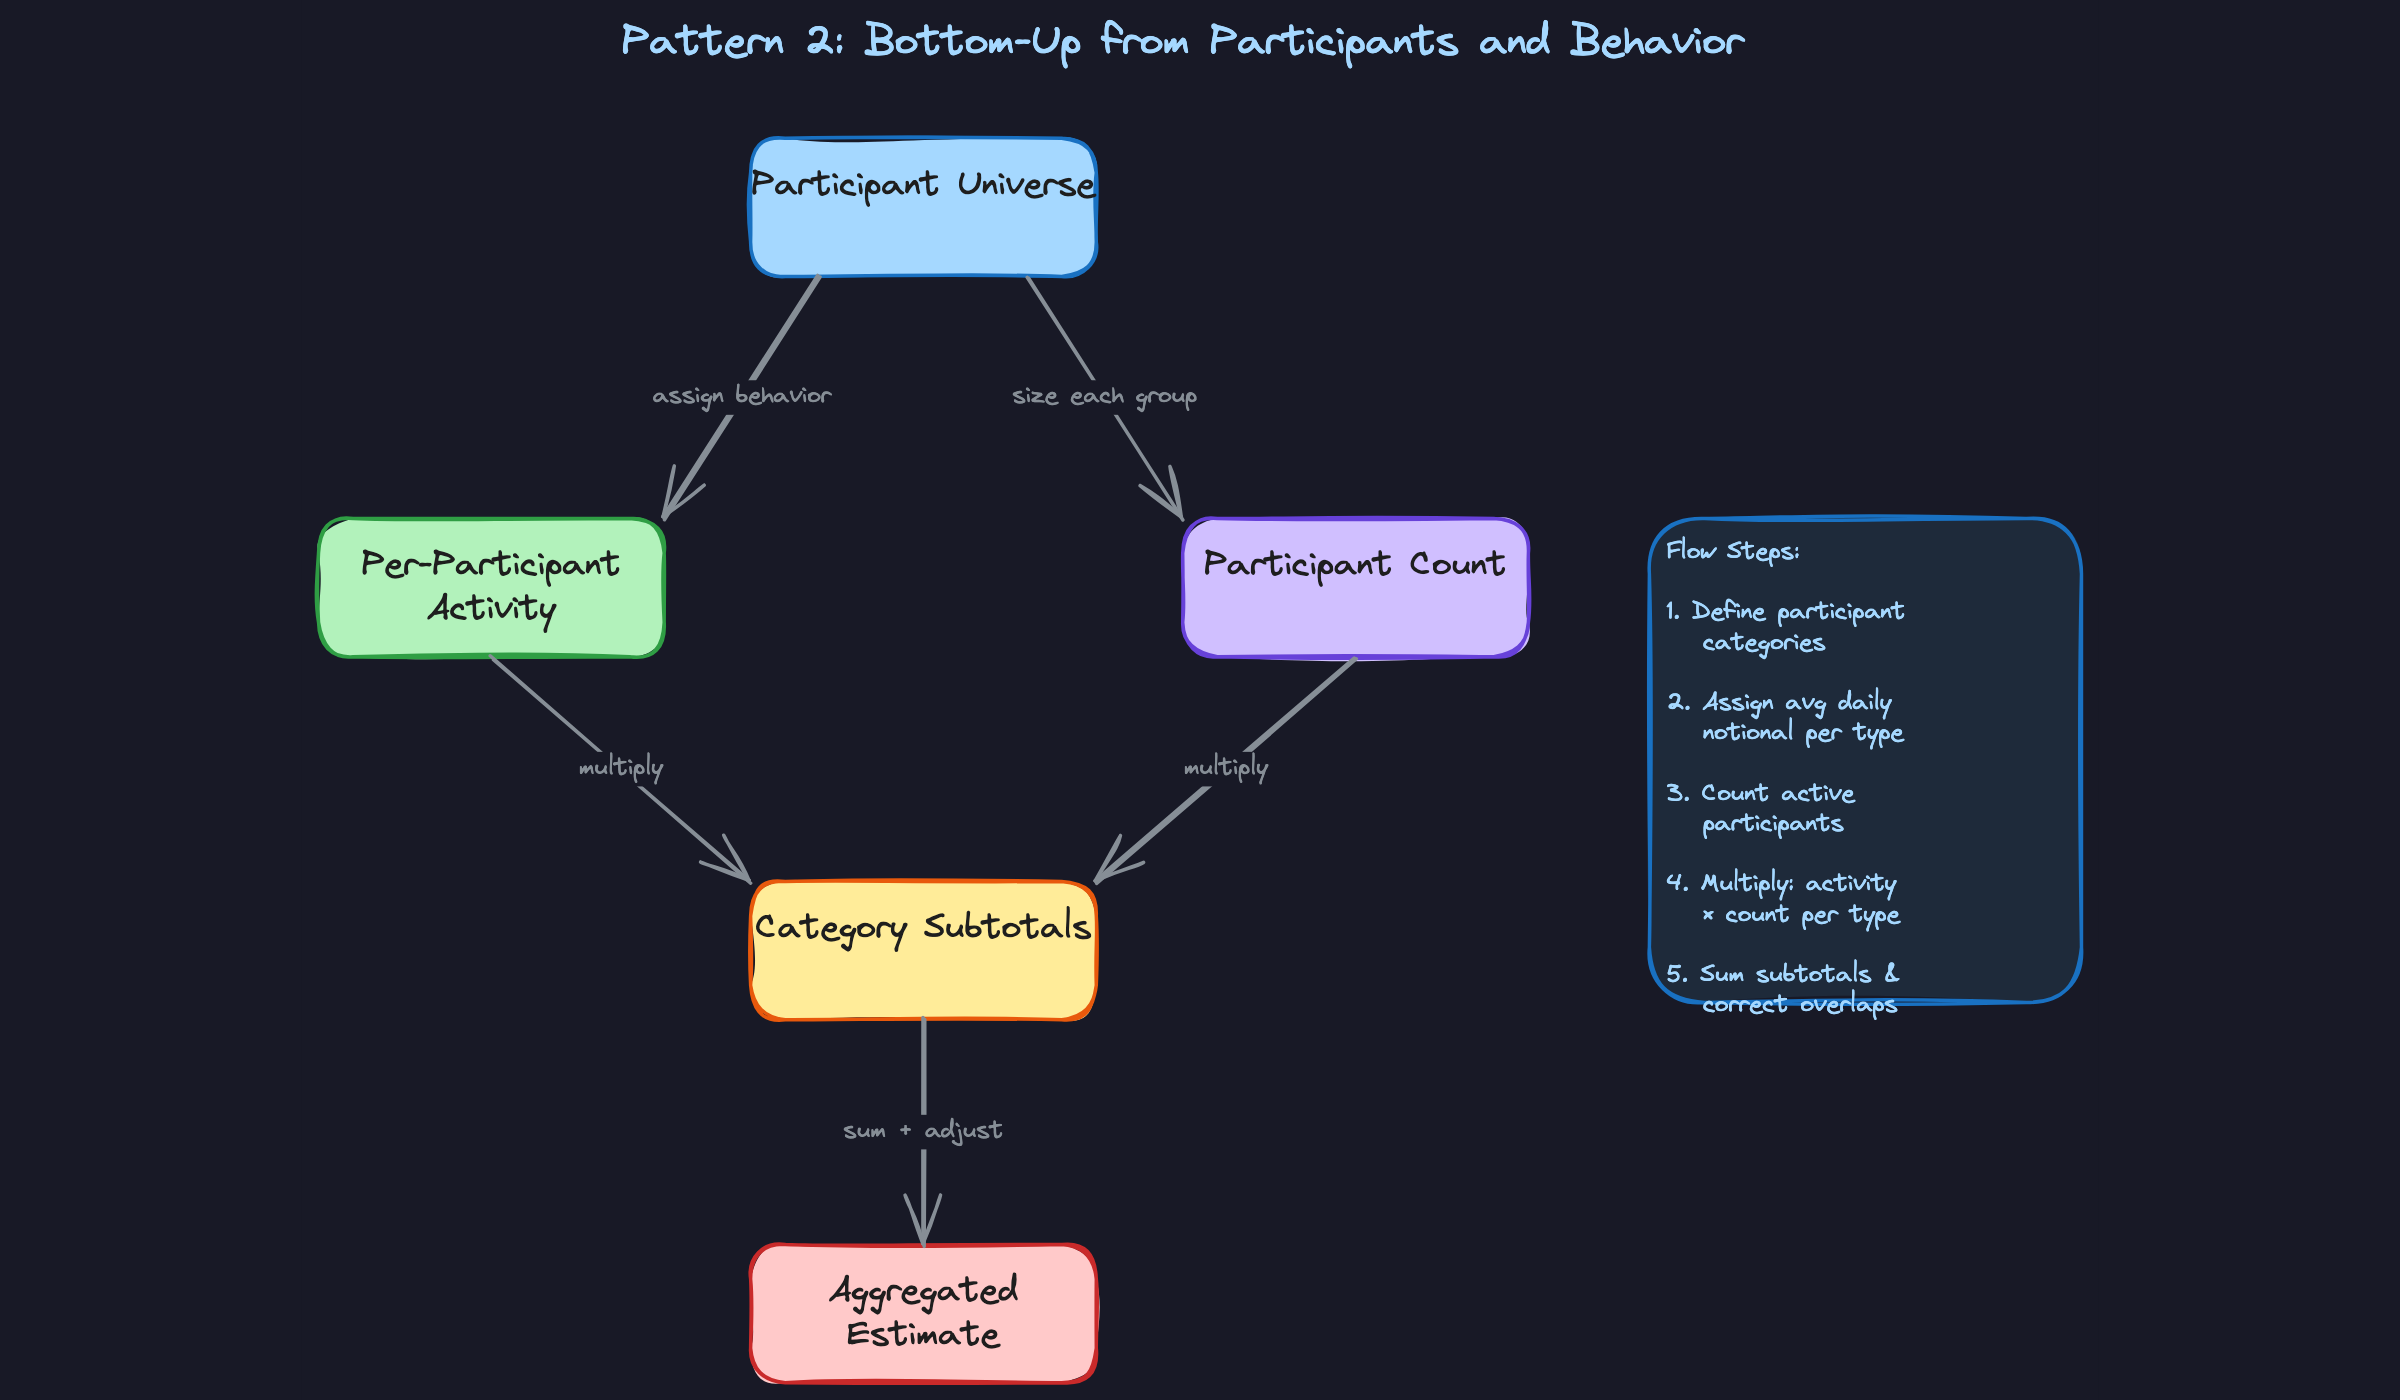
Instead of starting at the top and slicing down, you build up from individual actors. Who trades? Retail investors, hedge funds, market makers, and institutions. How much does each group trade per day? Multiply count by activity, sum across groups, and you have your estimate.
Here's what that looks like for US equity volume. Retail: maybe 20 million active traders, averaging $5,000 notional per day. That's $100B. Institutions (mutual funds, pension funds, ETFs): maybe 5,000 entities averaging $50M per day, giving $250B. Hedge funds and market makers are harder to size but add another $100-150B. Total: roughly $450-500B per day, which cross-validates nicely against the top-down answer.
The double-counting trap is real here. When a retail investor buys a share, a market maker sells it. That's one transaction, but both sides show up in your participant counts. You'll typically want to apply a correction, or just count one side of each trade and note the assumption explicitly.
When to reach for this: Use it when you have better intuition about individual behavior than about the aggregate. "How much do US retail investors trade daily?" or "estimate the notional activity of US hedge funds" are natural fits.
Velocity-Based Estimation via Turnover Rate
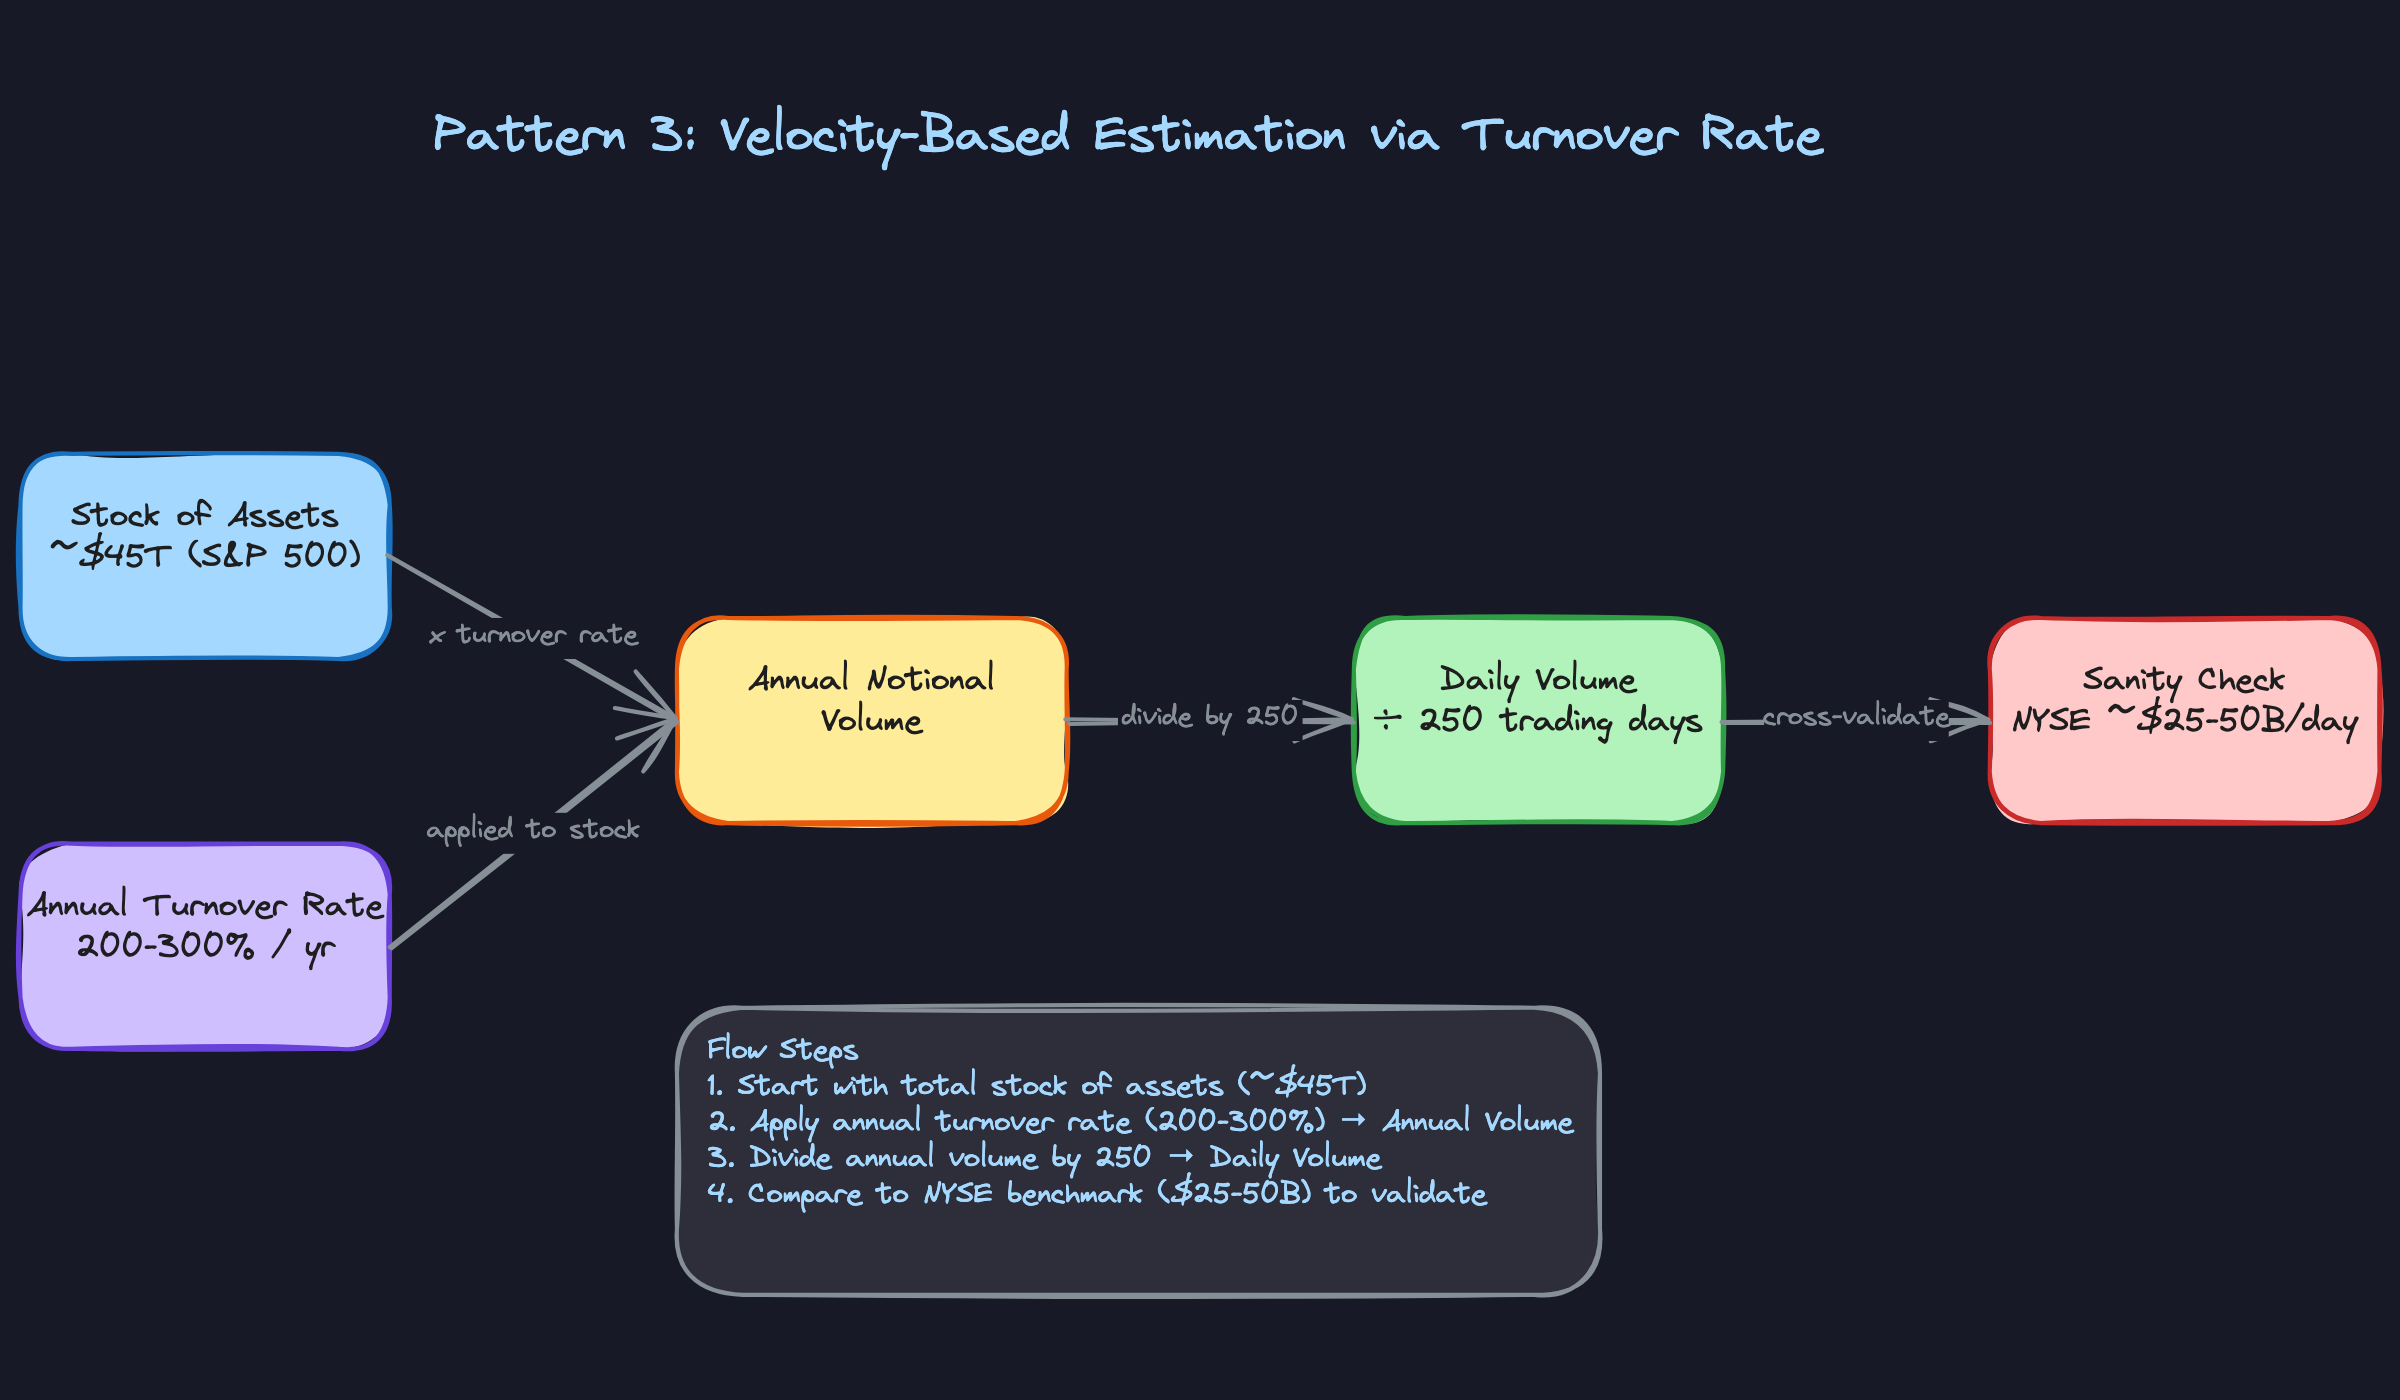
This one is particularly powerful for flow-based quantities. The core idea: if you know the total stock of assets in a market and how frequently that stock turns over, you can derive the flow.
US equities have a market cap around $45T (anchoring to the S&P 500 plus small/mid caps). Annual equity turnover in the US is roughly 200-300%, meaning the entire float trades two to three times per year. At 250% annual turnover, that's $45T x 2.5 = $112.5T per year in notional traded. Divide by 250 trading days: $450B per day. That's consistent with what you'd find reported for NYSE and Nasdaq combined, which is a good sign your assumptions are reasonable.
Turnover rate is the assumption you'll get challenged on most. Be ready to defend it. US equities are among the most liquid markets in the world, so 200-300% is defensible. Emerging market equities might be 50-100%. Fixed income varies wildly by instrument.
When to reach for this: Any time the question is about trading flow and you can anchor to a known stock of assets. FX, rates, and equity derivatives all work well with this approach.
Comparative Scaling from an Analogous Market
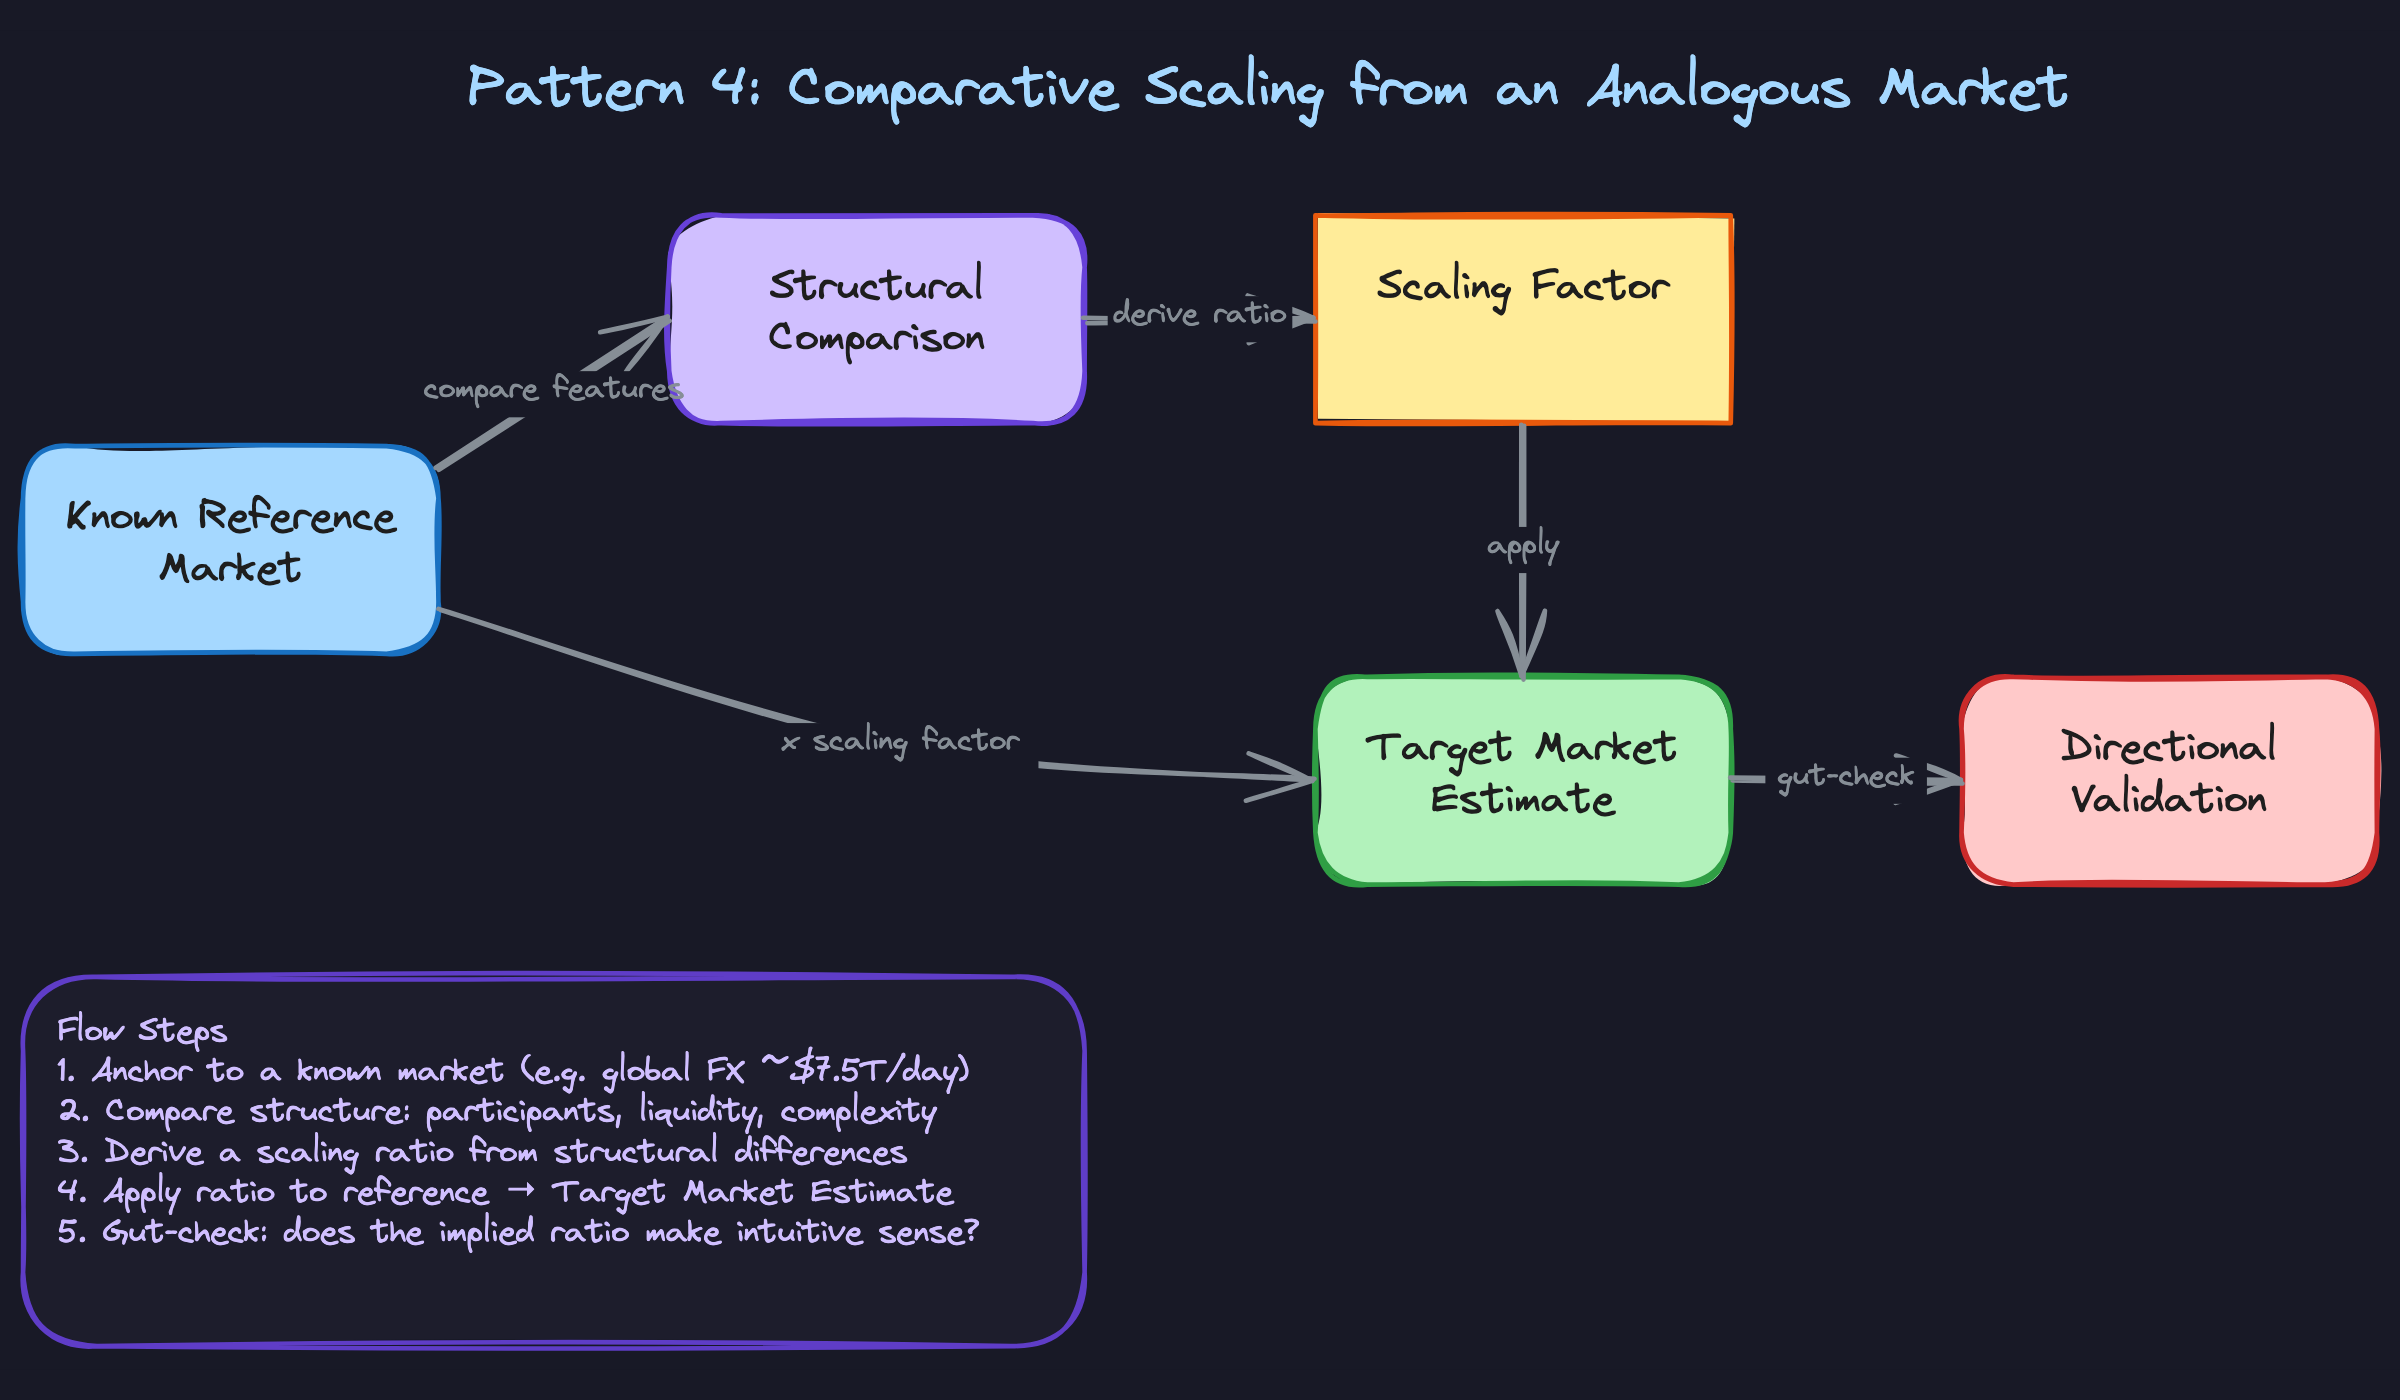
Sometimes you know one market cold and need to estimate a related one. Comparative scaling says: anchor to what you know, identify the structural differences, and derive a scaling factor.
Global FX is a good reference point at roughly $7.5T per day in notional turnover. If you're asked to estimate US equity options notional volume, you can reason about the relationship. Options are more complex instruments, used by a narrower participant base, and the US equity options market is large but not FX-large. A reasonable scaling factor might be 3-5% of global FX, giving $225-375B per day. You'd then sanity-check that against what you know about the underlying equity market (options notional often runs 50-100% of the underlying equity notional in active markets), which is consistent.
The risk with this pattern is that your scaling factor can hide a lot of uncertainty. Be explicit about what drives the ratio. Is it participant count? Instrument complexity? Geographic concentration? The more you can justify the scaling factor structurally, the more credible your answer.
When to reach for this: Best when you're asked about a market you're less familiar with, but you can draw a clear structural analogy to one you know well. It's also a great cross-check method after you've already run a top-down or bottom-up estimate.
Choosing Your Pattern
| Pattern | Best anchor | Ideal for | Main risk |
|---|---|---|---|
| Top-Down (Market Cap) | Known aggregate | Total market size questions | Carve-out percentages are hard to defend |
| Bottom-Up (Participants) | Individual behavior | Activity-level questions | Double-counting, participant sizing errors |
| Velocity (Turnover Rate) | Stock of assets | Flow and volume questions | Turnover rate assumption is fragile |
| Comparative Scaling | Analogous market | Unfamiliar markets | Scaling factor can obscure bad assumptions |
For most interview problems, you'll default to top-down or velocity, since both anchor to numbers that are easy to memorize and defend. Reach for bottom-up when the question is specifically about a participant segment, or when the interviewer pushes back on your aggregate and you need a second angle. Comparative scaling is best held in reserve as a cross-check, not a primary method. The strongest answers in practice combine two patterns, run them independently, and note when they converge.
What Trips People Up
Here's where candidates lose points — and it's almost always one of these.
The Mistake: Reaching for Numbers Before You Have a Structure
You get the question, you feel the pressure, and you start doing arithmetic. "Okay so if there are 330 million people in the US, and maybe 20% invest in equities..." The interviewer is already skeptical.
What they're watching for in the first 30 seconds is whether you'll pause and frame the problem before touching any numbers. Candidates who jump straight to arithmetic signal that they're pattern-matching to a memorized approach rather than actually thinking. When your structure is shaky, every number you produce is suspect, even if the arithmetic itself is correct.
Before you say a single figure, say something like: "Let me think about how to decompose this. I think the cleanest approach is top-down from market cap, because I have a decent anchor there. Let me walk through that." One sentence of framing buys you enormous credibility.
The Mistake: Citing a Number You Can't Reconstruct
This one is subtle and it catches a lot of well-prepared candidates. You've done your homework. You know that US equity daily volume is roughly $400 billion. You say it confidently. The interviewer says, "Interesting. How do you know that?"
If your answer is some version of "I read it somewhere," you've lost the thread. Memorized benchmarks are only useful if you can derive them from first principles when challenged. The interviewer isn't asking to be difficult; they're checking whether you understand the number or just know it.
Treat every benchmark you cite as something you should be able to reconstruct on the fly. If you say "$45 trillion S&P 500 market cap," be ready to get there from constituent count, average market cap per company, and rough distribution across size tiers. The benchmark is a shortcut, not a crutch.
The Mistake: Losing Track of Units Mid-Calculation
This is the most expensive arithmetic error you can make, and it's invisible until your final answer is off by a factor of 250. The classic version: you estimate annual notional volume, forget to divide by trading days, and hand the interviewer a number that's 250 times too large. Or you mix up notional value with share count and end up with units that don't mean anything.
Write your units next to every number. Not just in your head. On paper, out loud, wherever you're working. "$90 trillion per year, divided by 250 trading days, gives me $360 billion per day." That narration serves two purposes: it keeps you honest, and it lets the interviewer follow your logic and catch errors before they compound.
If you're ever unsure whether a number feels right, ask yourself what the units are and whether they match what the question asked for. "Daily notional in dollars" is a different quantity from "daily share volume" and from "annual turnover ratio." Confusing them isn't a rounding error; it's a structural error.
The Mistake: Giving a Point Estimate and Stopping There
"My estimate is $412 billion per day." That sounds precise. It reads as confident. Interviewers at Jane Street and Optiver hear it as a red flag.
False precision signals that you don't understand the uncertainty in your own model. You made five or six assumptions to get to that number. Each one has a range. The compounded uncertainty across all of them means your answer could reasonably be anywhere from $250 billion to $600 billion, and pretending otherwise suggests you haven't thought about that.
Always close with a range and a brief note on what drives the width of it. "I'd put this at $350 to $500 billion per day. The biggest swing factor is the turnover rate assumption; if that's 200% annually instead of 300%, the answer drops by a third." That's a calibrated answer. It shows you understand your model's sensitivity, which is exactly what a trader needs to do.
How to Talk About This in Your Interview
When to Bring It Up
The trigger is almost always an open-ended quantity question with no obvious formula. Listen for:
- "How big do you think the US options market is?"
- "Roughly how much notional trades in equities each day?"
- "Can you estimate the size of the FX derivatives market?"
- Any question where the interviewer says "just ballpark it" or "walk me through your thinking"
The moment you hear a sizing question, your first move is to say which decomposition you're going to use and why, before touching a single number. That's the signal they're waiting for.
Sample Dialogue
This exchange is estimating daily notional volume in US equity options. Notice how the candidate narrates every assumption and flags uncertainty in real time.
The candidate doesn't freeze when challenged. They identify the specific assumption being questioned, state their confidence level, and re-derive from there.
Follow-Up Questions to Expect
"How would you sanity check that number?" Cross-validate using a second method: "I'd try bottom-up from participant counts. If there are roughly 1,000 active options market participants trading an average of $50 million notional per day, that's $50 billion, which is consistent."
"What if I told you the actual number is $500 billion? Where did you go wrong?" Don't panic and don't abandon your framework. Say: "I'd want to know which assumption is off. My open interest estimate or my turnover rate. If open interest is closer to $5 trillion rather than $1 trillion, the math works out directly."
"Does this number change significantly day to day?" Yes, and saying so is a sign of market awareness. "Options volume is highly correlated with realized volatility and VIX. On a high-vol day, volume can easily be 2-3x a quiet day, so the range matters more than the point estimate."
"Why did you choose top-down here instead of bottom-up?" "Because I had a reliable anchor in equity market cap. Bottom-up would require estimating participant counts, which I'm less confident in for options specifically. I used bottom-up as the cross-check rather than the primary path."
What Separates Good from Great
- A mid-level candidate gives a single number with a clean derivation. A senior candidate gives a range, explains what drives the width of that range (volatility regime, notional definition), and tells you which assumption they'd update first if the answer came back wrong.
- Mid-level candidates treat the interviewer's pushback as a sign they're failing. Senior candidates treat it as information. "Which assumption do you want me to revisit?" is one of the highest-signal phrases you can say in this kind of interview.
- The best answers close with a calibration statement: "I'd put 70% confidence on $40-80 billion, with meaningful probability of being outside that range on either side if my open interest estimate is off." That's not hedging. That's what quantitative reasoning actually sounds like.


